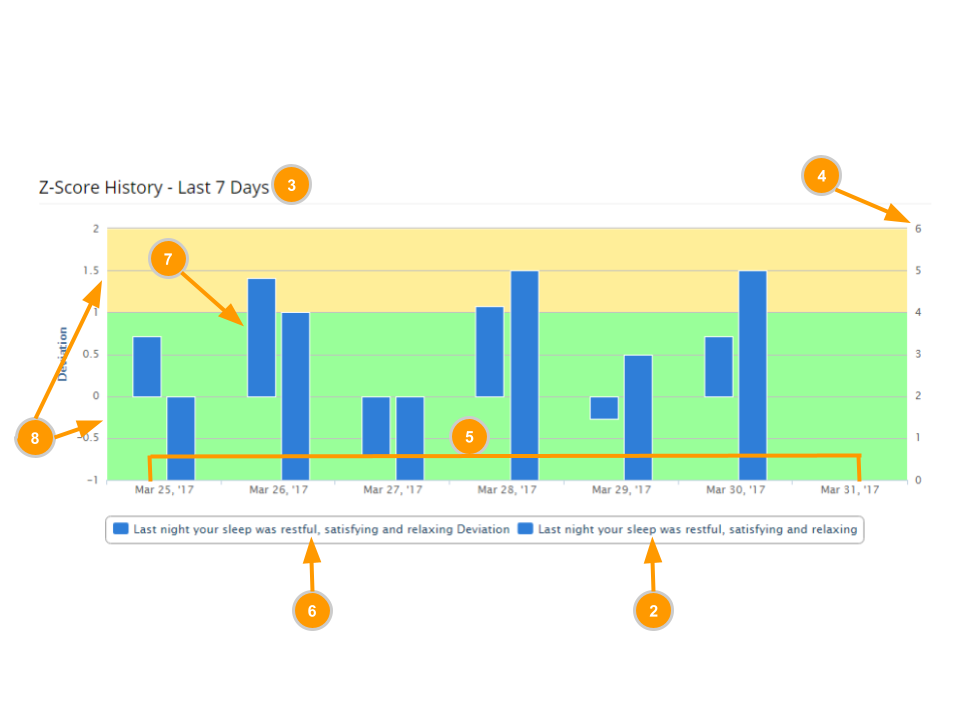
Z-Score History Dashboard
ATHLETE - Display multiple fields latest values, each compared to it's prior values as a z-score with thresholds.


-
Dashboard Name
A unique name to identify this dashboard when editing or assigning to layouts
-
Field
The testing/questionnaire field that you have entered data into that you would like to graph
-
Label
The title of the chart that will appear in Athlete Central
-
Unit
The unit that the field has. It should fill in automatically if your field has a unit already assigned
-
Latest number of values to display
The number of values for the field that will display on the dashboard
-
Moving average across how many values
The number of values the standard deviation calculation will be pulled off of
-
Plot Type
Options include: Line, Spline (smooth fitted curve), Area (line with filled-in area under line), Column (vertical bar graph)
-
Thresholds
The color ranges you would like to have displayed on your dashboard
Back to Dashboards and Assessments.
Comments
0 comments
Please sign in to leave a comment.