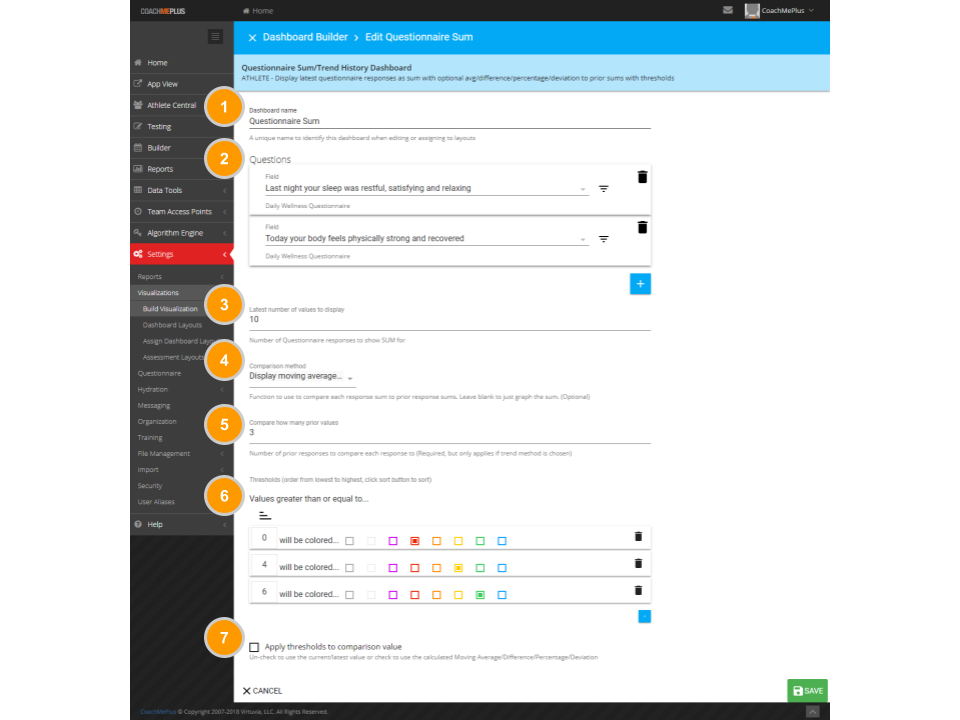
Questionnaire Sum/Trend History Dashboard
ATHLETE - Display latest questionnaire responses as sum with optional avg/difference/percentage/deviation to prior sums with thresholds.


-
Dashboard Name
A unique name to identify this dashboard when editing or assigning to layouts.
-
Field
The testing/questionnaire field that you have entered data into that you would like to graph.
-
Latest Number of Values to Display
The number of values for the field that will display on the dashboard.
-
Comparison Method
Compare data using moving average, difference vs. prior values, percentage of prior values, standard deviation vs. prior values or deviation score vs. prior values.
-
Compare How Many Prior Values
Number of prior responses to compare each response to (Only required if trend method is chosen).
-
Thresholds
Ordered from lowest to highest, click sort button to sort.
-
Apply Thresholds to Comparison Value
Un-check to use the current/latest value or check to use the calculated moving average/different/percentage/deviation.
Back to Dashboards and Assessments.
Comments
0 comments
Please sign in to leave a comment.