This article will show you:
- Suggestions for selecting periods.
- Various examples of different periods.
Select Period (Optional)
This step is optional. If you want to include a time period for what data you want displayed, you can put in a request to do so. Some suggestions are:
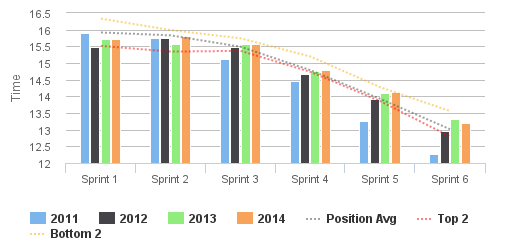
- Start Date, End Date, or Interval (Optional) (Example 1)
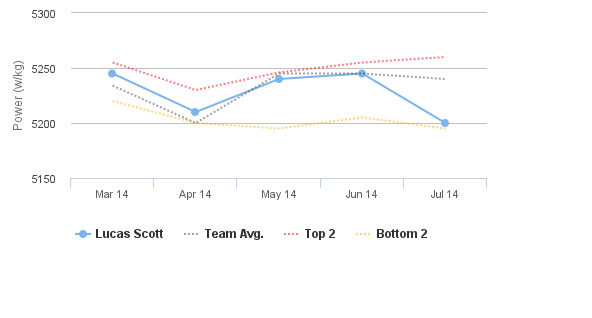
- OR a List of Dates (Example 2)
- OR if they were Relative to another Series (Example 2)
Below are a list of examples of periods for a chart:
Example 1 - Start Date, End Date or Interval (Optional):

For this chart, the start date is from 2011 to end date of 2014. You can also have intervals, which is an optional feature for your chart. The interval for this chart would be: Display the average time for each sprint per year from 2011-2014.
Example 2 - List of Dates/Relative

- List of Dates - This chart shows a data that is plotted across a range of dates (March 14 - July 14).
- Relative - This chart shows the the athlete's (Lucas Scott) average power compared to the team average. Relative allows you to compare your individual athlete to the team from a list of dates.

Comments
0 comments
Please sign in to leave a comment.