This article will show you:
- Introduce various components you can use to create a customized box plot.
Understanding Boxplots
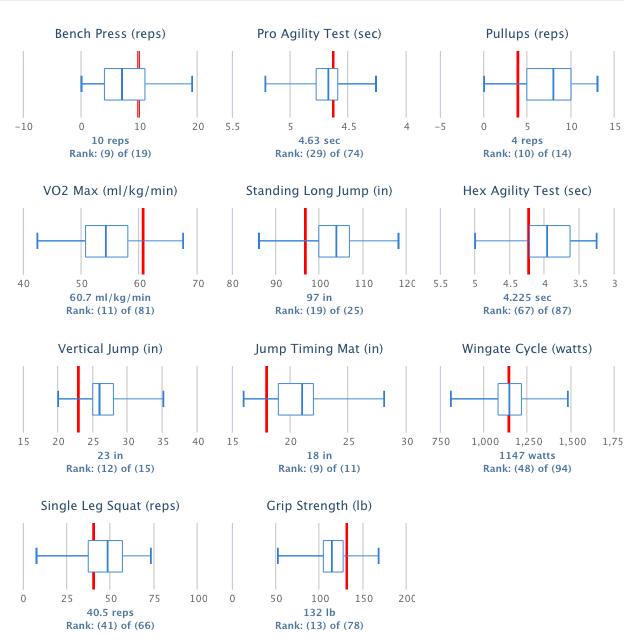
The box plot is a standardized way of displaying the distribution of data based on the five number summary: minimum, first quartile, median, third quartile, and maximum. Box plots allow you to rank your athletes amongst the team.
Example of a Boxplot:

The boxplots tell you where your athlete is performing for each exercise compared to the rest of the team. This is useful for ranking your athletes for each exercise.
To learn and know what components to provide to create your customized charts, click here.

Comments
0 comments
Please sign in to leave a comment.