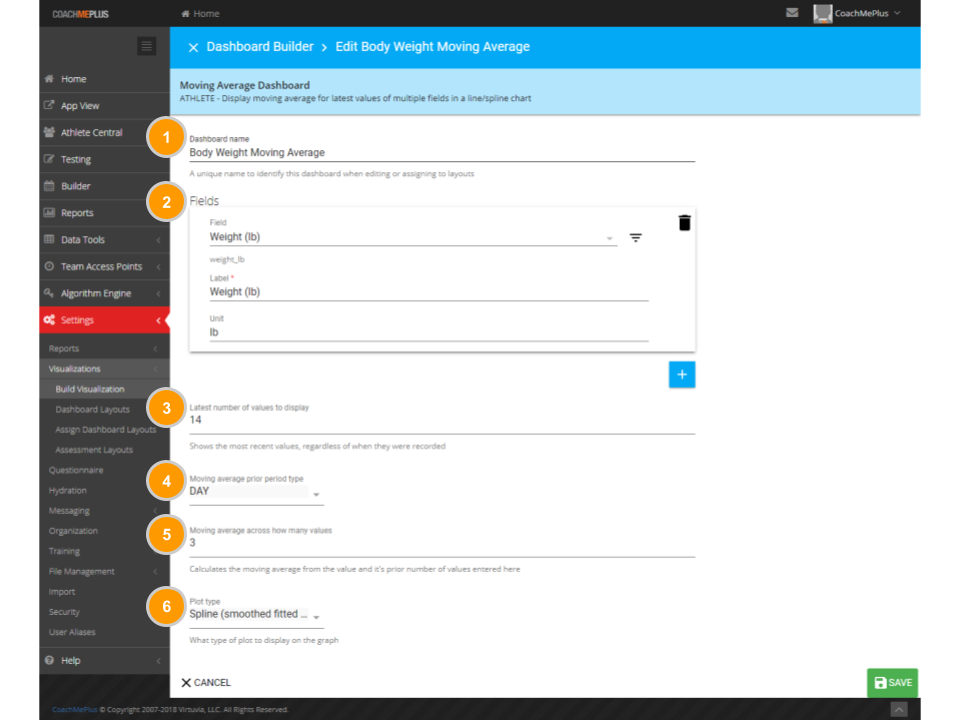
Moving Average Dashboard
ATHLETE - Display moving average for latest values of multiple fields in a line/spline chart.


-
Dashboard Name
A unique name to identify this dashboard when editing or assigning to layouts
-
Field
The testing/questionnaire field that you have entered data into that you would like to graph
-
Latest Number of Values to Display
Shows the most recent values, regardless of when they were recorded
-
Moving Average Prior Period Type
Day, Week, Week (Mon-Sun), Month, Latest
-
Moving Average Across How Many Values
Calculates the moving average from the value and it’s prior number of values entered here
-
Plot Type
What type of plot to display on the graph. Options:Line, Spline (smoothed fitted curve), Area (line with filled-in area under line), Column (vertical bar graph)
Back to Dashboards and Assessments.
Comments
0 comments
Please sign in to leave a comment.